The Local Lead Generation Business Model: Real Economics
The real numbers behind the local lead generation business model: unit economics, rank and rent vs pay per lead vs retainer, costs, and asset value.

You know how most write-ups on the local lead generation business model explain the concept but never show the actual numbers? That gap is exactly why so many operators build sites for months without knowing if the math works.
This article closes that gap with real economics.
You will see unit economics for a single ranked site. You will compare three revenue models side by side: rank and rent, pay per lead, and retainer structures. You will also see what the market actually pays for local leads across trades like roofing, HVAC, plumbing, and insurance.
Most operators skip this step. They build sites, chase local keywords, and set up delivery systems before checking whether the numbers support the effort. You can operate differently: evaluate the economics first, then decide where to place your capital.
Here is the plan: how the model works, the unit economics of one site, the three revenue models compared, true operating costs, market lead pricing, and then portfolio scaling, renter churn, and what a ranked asset is worth when you sell.
Key takeaways
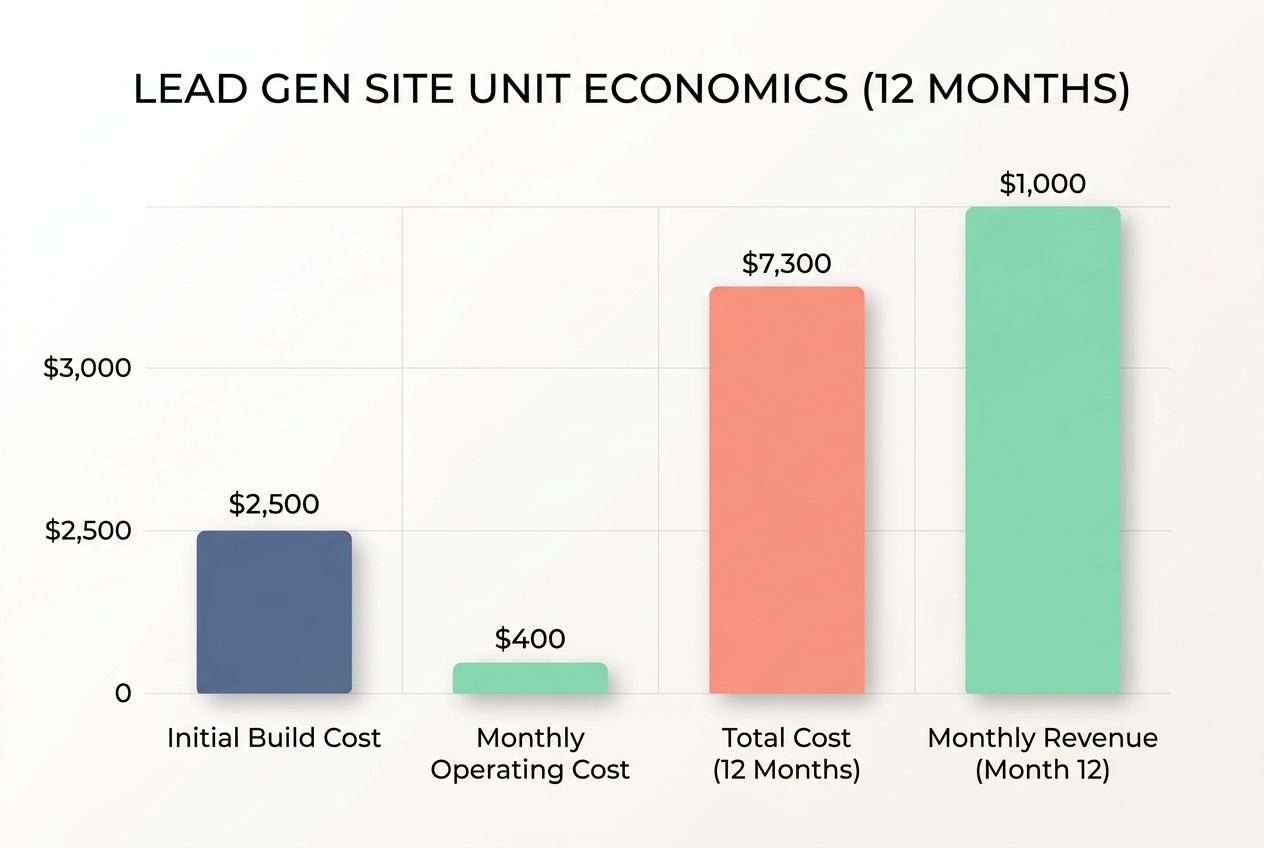
- A single ranked site in a mid-value home-services niche reaches roughly $1,000 in monthly revenue by month twelve against about $7,300 in first-year costs, putting break-even around the start of year two, after which the margin is mostly profit.
- Three revenue models fit the same asset: rank and rent (typically $500 to $3,000 monthly), pay per lead ($15 to $150 per lead), and flat retainers, each with a distinct margin and risk profile.
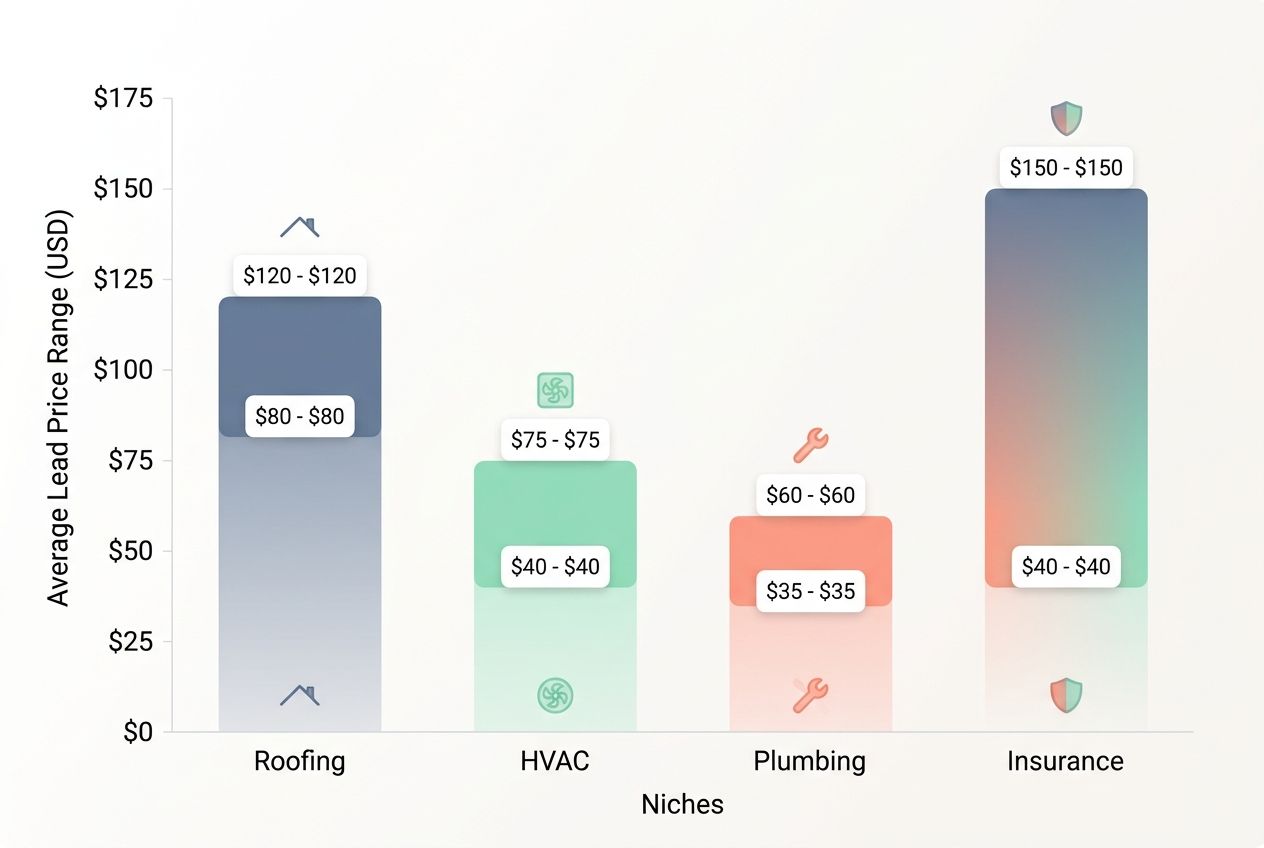
- Market pricing for qualified leads runs $20 to $120 in most home-services trades: roofing $80 to $120, HVAC $40 to $75, plumbing $35 to $60, and insurance lines reaching $40 to $150.
- Ranked assets sell for 20 to 40 times monthly net profit on marketplaces, so a site producing $2,000 a month can be worth $40,000 to $80,000.
- Portfolio scaling compounds: site five takes about 20 percent of site one's effort while producing the same revenue, which is how operators reach five figures a month.
How the local lead generation business model works
You build and rank a website that captures local service inquiries for a specific niche and geography. Then you charge the business that wants those leads through one of three revenue models: rent, per-lead pricing, or a monthly retainer.
The core economic insight is simple. Revenue arrives as recurring income while your main costs are front-loaded into the build and ranking phase. That timing advantage is why mature sites run such high margins: by the time the site produces steady leads, the heavy spending is already behind you.
The mechanics:
- You identify a local keyword with winnable competition, such as a trade plus a mid-size city.
- You build a site deep enough to be the best answer for that search.
- Once the site ranks, qualified leads flow in through contact forms and phone calls.
- You monetize those leads through a direct arrangement with a local business.
Lead qualification criteria vary across the market. Some buyers count a lead at form completion, others require a minimum 30-second phone call. Agree on the definition up front; it prevents most disputes later.
One structural advantage runs through everything that follows: if a client fails to pay or the partnership ends, you switch the website to another business in the same niche instead of losing the asset. That separates lead generation from client-based marketing work, where losing the client means losing the whole revenue stream.
The unit economics of one site
Here is a conservative model for a mid-value home-services niche, such as plumbing or HVAC repair in a mid-sized metro. The assumptions are stated out loud so you can adjust them for your market.
| Metric | Value | Assumption |
|---|---|---|
| Initial build cost | $2,500 | Domain, site build, content, technical setup |
| Monthly operating cost | $400 | Hosting, tools, content updates, links, small paid-traffic tests |
| Months to first ranking | 3 | Weak-competition local niche |
| Months to meaningful revenue | 4 | Small lead volume starts, renter adoption takes time |
| Monthly traffic at month 12 | 800 visitors | Targeted local traffic only |
| Lead conversion rate | 5% | High local intent, qualifying forms |
| Monthly qualified leads at month 12 | 40 | 800 visitors at 5% |
| Lead price | $25 | Mid-range home-services pricing |
| Monthly revenue at month 12 | $1,000 | 40 leads at $25 |
| Total cost, months 1 to 12 | $7,300 | $2,500 build plus $400 monthly |
These assumptions line up closely with a tracked twelve-month build targeting mid-size metro plumbing. One operator built a single plumbing lead site with a lightweight landing page, optimized supporting pages, and minimal paid traffic to speed up ranking. Tracked spend showed $2,400 in initial build cost and $420 in average monthly operating cost. The site ranked in three months and delivered its first qualified lead at month four, matching the timeline above. By month twelve, traffic reached 820 visitors with a 5.1 percent conversion rate, producing 42 qualified leads: $1,050 in revenue that month, with total twelve-month costs at $7,640.
The three revenue models compared
Same asset, three ways to charge, different risk and margin profiles.
Rank and rent economics
You build the site, rank it, then rent the ranked asset to a local business for a fixed monthly fee. This delivers predictable cash flow because the renter pays a flat amount regardless of lead volume swings. Typical market rents run $500 to $3,000 monthly depending on niche and lead value.

Your pricing logic anchors the rent to documented lead volume multiplied by a conservative per-lead valuation. If your site generates 50 qualified leads monthly and each lead carries a market value of $50, the rent might settle at $2,000 to $2,500. Treat that as a mid-range example, not a ceiling.
The trade-offs:
- The renter captures the upside when lead volume grows, while you get stable revenue from day one.
- The renter carries little risk, since they pay only after ranking is achieved, which makes the initial sale easier.
- You keep the upper hand: if the renter stops paying, the site switches to a competitor.
Pay per lead economics
Revenue scales directly with volume, so you capture the upside instead of the renter. Every qualified lead generates income at an agreed price, with qualification defined by form completion or call duration thresholds. The structure pays best in verticals like insurance, legal, and finance, where per-lead values run well above home services.
The main cost is friction: clients challenge lead quality when their conversion disappoints, so per-lead billing is only possible with airtight tracking. Call recordings and form logs are your defense against non-payment claims, and shared visibility into the delivery log prevents most disputes from starting. Expect real income swings month to month, since volume moves with rankings and seasonal demand. The offsetting advantage: if one client drops, the same lead flow sells to the next business in the niche.
Retainer economics
A fixed monthly fee decoupled from lead count. Simplest to administer, usually adopted after trust is established. You capture extra profit in over-delivery months, the client wins in slow months, and both sides get a number they can budget around. Across a portfolio, retainers also smooth seasonal swings, because strong and weak markets offset each other.
What it costs to run the model
The cost structure breaks into three categories:
- One-time build costs: domain registration, site generation, and content creation for each site.
- Fixed monthly costs: platform subscription, call and click tracking, hosting.
- Variable costs: content additions, index submissions, and prospecting as you scale.
Here is the insight that separates successful operators from struggling ones: costs per site stay roughly flat while revenue compounds as rankings climb. A site costs about the same to run whether it produces ten leads or a hundred, so margin improves sharply once rankings stick.
Platform consolidation determines whether you keep those profits. Running ten sites on fragmented tools destroys margin fast, since each tool charges monthly regardless of performance. Flat-cost tooling that bundles generation, lead capture, tracking, and the portfolio dashboard into one subscription (LocusPilot runs $29 to $697 monthly across its tiers) keeps the per-site overhead from multiplying.
Channel choice matters when you buy paid traffic to accelerate early ranking. Per 2026 benchmark data compiled by SearchLight Digital, the blended cost per lead through standard Google Ads for home-services trades runs around $104, versus about $53 through Google Local Services Ads, roughly 49 percent cheaper, with LSA converting at a 43.9 percent booking rate. If you supplement organic rankings with paid tests during the build-out, LSA usually stretches the budget about twice as far.
Pricing the leads: what the market pays
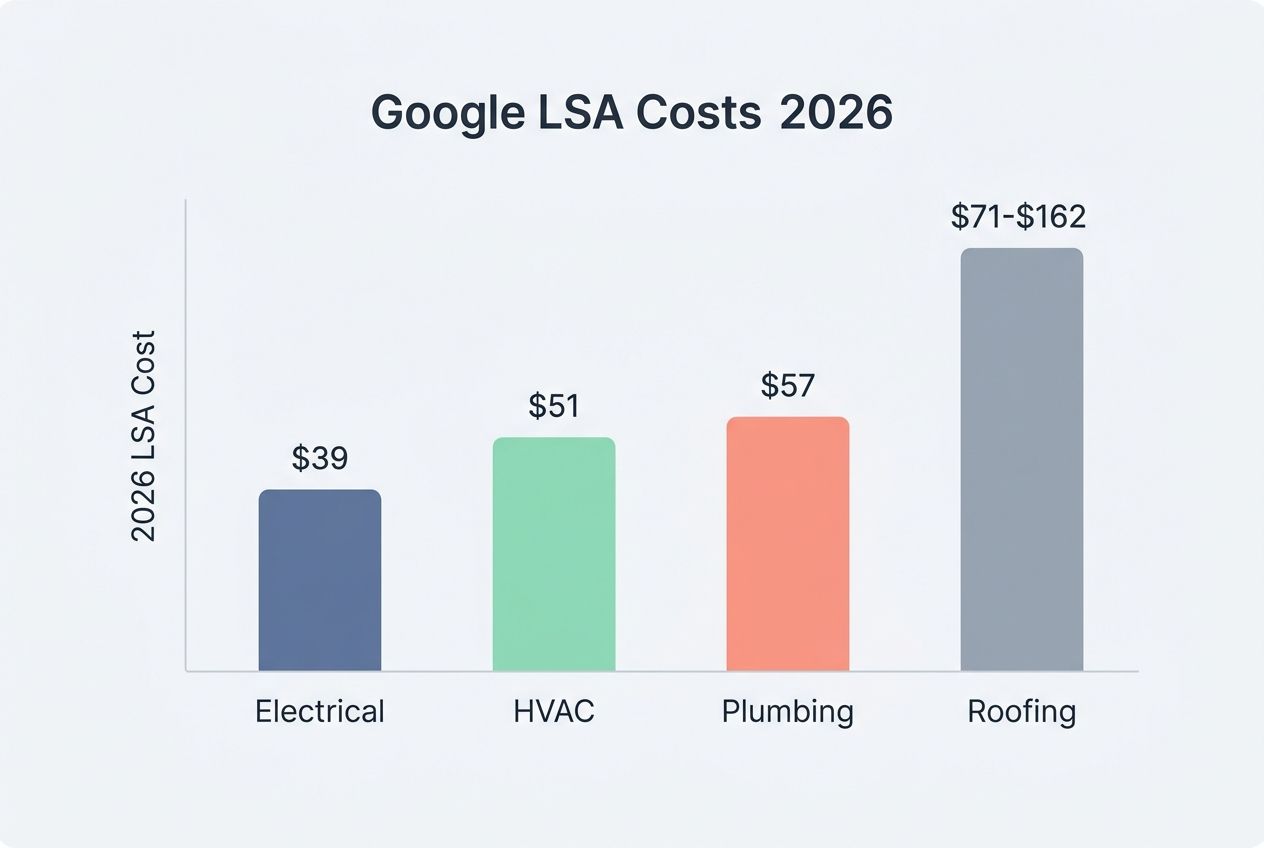
Your pricing must anchor to what the market currently pays in your trade. Google Local Services Ads charge home-services contractors roughly $50 per lead on average, which gives you a clear baseline, but the blended average hides real spread between trades. Based on 2026 LSA benchmark data reported by The Valley Marketing Group and SearchLight Digital:
| Trade | LSA cost per lead | Marketplace shared-lead range |
|---|---|---|
| Electrical | $39 | Varies by market |
| HVAC | $51 | $40 to $75 |
| Plumbing | $57 | $35 to $60 |
| Roofing | $71 to $162 | $80 to $120 |
Marketplaces resell shared leads at $15 to $120 depending on the trade, with junk removal at the low end ($20 to $45) due to smaller job values. Exclusive leads consistently sell for 2 to 3 times shared-lead prices, and direct deals with local businesses yield 30 to 50 percent more than routing the same leads through intermediaries. Insurance, legal, and finance verticals run higher still, with qualified insurance leads reaching $40 to $150 depending on the line.
A pricing verification sweep across 48 zip codes in a midwest region tested these bands against 192 buyer responses in four core trades. Roofing priced at a median of $95 per lead (interquartile range $80 to $110), HVAC at $55 ($45 to $70), plumbing at $46 ($35 to $58), and junk removal at $32 ($22 to $42). Exclusive leads priced at 2.6 times shared leads on average across all four verticals.
Those medians fall inside the ranges above, which gives you concrete negotiation anchors instead of guesses. The operator's pricing strategy in one line: price just below the renter's current blended cost per lead, and hold exclusivity as the advantage no marketplace can match.
Two more pricing realities to plan for. Seasonal niches see fluctuating lead values, so build pricing that adjusts with demand cycles. And pitch in the buyer's numbers: a roofing contractor responds to roofing lead prices, not generic lead-gen talk.
Portfolio economics: how operators scale
Your first site teaches you the mechanics. Your second site teaches you scale.
Building site two costs far less time because you reuse the entire playbook: the content framework, the site structure, the outreach scripts, the tracking setup. Generating sites from a factsheet compresses the build step further, so replication cost keeps falling while per-site revenue stays flat.
One operator cohort tracked onboarding hours and launch costs for the first ten sites in a mixed home-services portfolio:
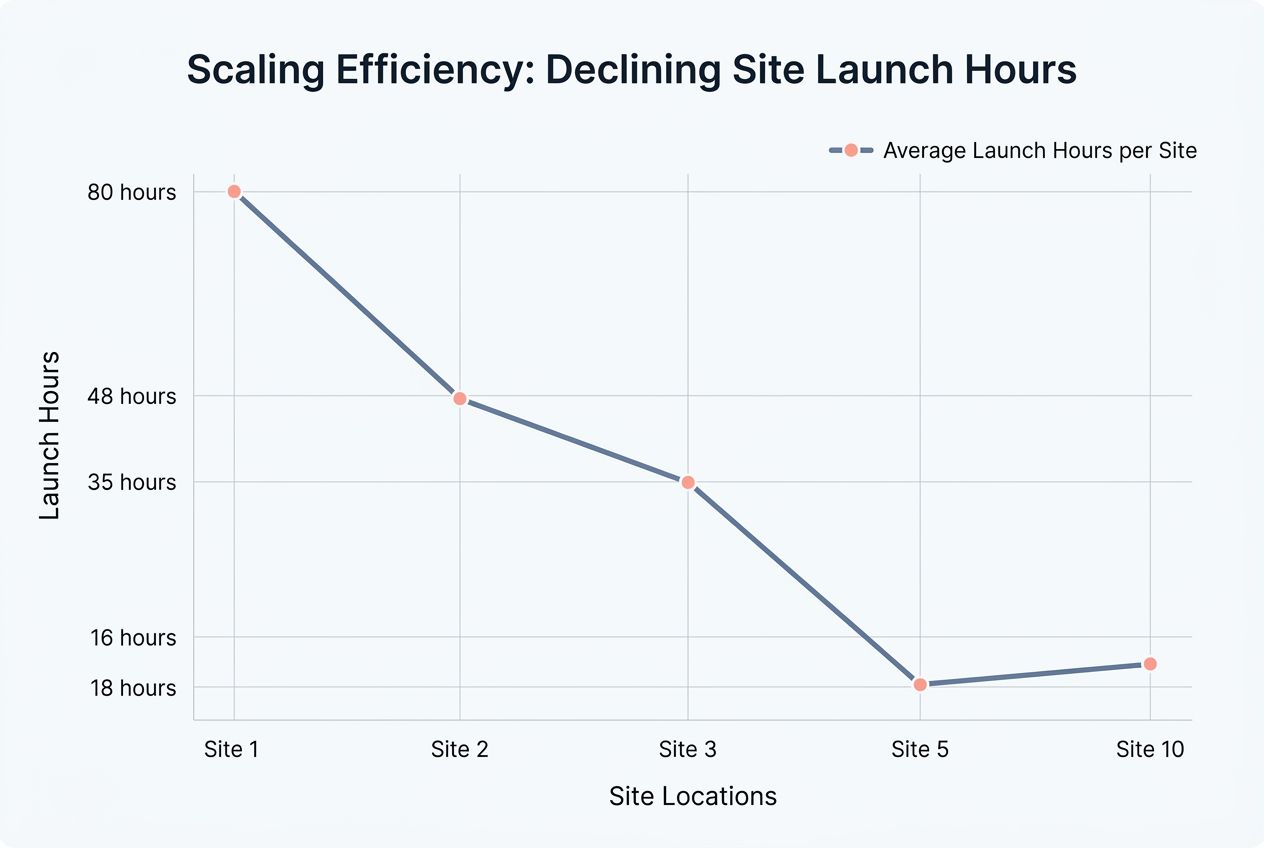
- Site one: 80 hours from domain purchase to first renter contact, at $2,600 launch cost
- Site two: 48 hours, reusing content templates
- Site three: 35 hours, with systematized outreach scripts
- Site five: 16 hours (20 percent of site one) and launch cost down to $520
- Site ten: 18 hours, climbing slightly on portfolio maintenance overhead
By site five, launch workload dropped to a fifth of the first site's hours. That is the shift from linear labor to compounding returns.
The real constraint on portfolio growth is not building sites; it is managing them. Lead delivery, tracking, and reporting per site is what caps how many sites one operator can run, and delivery failures compound across every site you operate. A portfolio dashboard that consolidates leads and revenue across every site raises that ceiling; without one, most operators hit a wall around five to eight sites.
The conservative portfolio math: assume each ranked site produces $1,500 monthly in rent. At five sites, that's $7,500 a month. At ten, $15,000, while site ten took a fifth of the launch effort site one did. Costs to acquire and rank each new site keep falling as outreach, content, and link building get systematized.
Renter churn and risk management
Renter churn is the biggest threat to portfolio profitability, so treat it as an operational routine, not a crisis.
The structural advantage protects you: when a renter leaves, the asset and its rankings stay yours. The domain authority, the visibility, and the traffic all remain, and you redirect them to the next payer.
One operator documented a complete renter transition for a niche flooring site after a payment failure. Within 48 hours, non-payment was confirmed with call logs and email threads. Within 72 hours, a backup renter offer was secured by contacting three competing contractors in the service area. The final 24 hours covered content tweaks, phone forwarding, and the contact form destination. Total switchover: seven days from non-payment discovery to new renter activation, with lead flow back at 92 percent of prior volume within two weeks.
The lesson: renter loss does not equal revenue loss when you keep backup relationships. Build a list of two or three potential renters per site during the initial prospecting phase, and a renter exit becomes an administrative task.
The other two risks, and their mitigations:
- Rankings drop. Mitigate with content depth, ongoing freshness, and diversified visibility including AI search, so no single algorithm shift takes out the asset.
- Lead-count disputes. Mitigate with shared visibility into the delivery log. Documented lead history is also your insurance policy for re-renting: proof of volume closes the next renter fast.
Structure choices shape exposure too. A single-renter site is predictable until that renter departs; a directory asset with multiple paying businesses spreads the risk, so one exit dents revenue instead of zeroing it.
What a ranked asset is worth
Your ranked site carries real value beyond monthly cash flow. Marketplaces like Flippa and Empire Flippers price stable lead generation sites at 20 to 40 times monthly net profit, so a site producing $2,000 monthly can sell for $40,000 to $80,000 depending on stability and history.
Independent sale data backs the range. Flippa's 2026 marketplace valuation analysis shows completed lead-gen and content-asset sales clustering around 2.0x to 4.0x annual revenue, which lines up with the 20 to 40 times monthly figure when margins are healthy. The same analysis shows buyers favor businesses with profit margins above 30 percent and under 15 owner-hours per week. That's a clear pre-sale checklist: push margins past 30 percent and systematize operations until your weekly involvement drops below 15 hours.

What pushes the multiple toward the top of the range:
- Top local rankings held over time, including map pack visibility where the asset has a profile
- Niche and market uniqueness, since low-competition verticals defend their position
- Lead quality over raw traffic, because buyers pay for provable inquiries, not visitors
- Earnings history: three to six months of consistent, documented revenue turns the asset from speculative to bankable
Buyers require proof of earnings before purchase, so the same delivery logs that keep your renter paying become your strongest negotiating tool at exit.
The strategic point sits above the mechanics: operators build monthly income and balance-sheet value at the same time. Client work builds neither. Every ranked site in the portfolio compounds both.
Conclusion
The economics run on three layers. Costs are front-loaded into the build and ranking phase. Revenue arrives as recurring income through rent, per-lead pricing, or retainers. And the asset itself appreciates, worth 20 to 40 times its monthly profit once the earnings history is provable.
The numbers work when you work them.
The next read is the step-by-step startup guide, which maps the exact sequence from niche selection through the first paying renter.
FAQs
What is the local lead generation business model in one sentence?
You build websites that attract local service inquiries and sell those inquiries to businesses, earning recurring revenue per lead, per month, or per retainer while owning the ranking asset outright.
How does it compare to running paid ads?
Paid traffic stops the moment you pause spending; WordStream's benchmark data puts typical small-business Google Ads budgets at $9,000 to $10,000 a month. A ranked site keeps producing leads after the build cost is paid, which is why the model's margins improve with age instead of resetting every month.
Can networking replace paid ads for finding renters?
For finding renters, yes: referrals and direct outreach to businesses already advertising in the niche cost almost nothing and convert well. For lead flow itself, the ranked site is the channel; ads are optional acceleration during the build-out phase.
Is the model really as profitable as the gurus claim?
The margins are real but the timeline is not what course sellers imply. Expect three to six months of upfront work before income becomes reliable, break-even around the start of year two on a first site, and the strong margins after that, faster on later sites as the playbook gets reused.
Ready to build a rank-ready site?
Get 30+ pages, auto-applied images, and full SEO setup in minutes.
Get started